
- Industry
- E-commerce / Consumer Goods
- Service
- Amazon PPC Optimisation & Listing Support
- Region
- United States
- Timeline
- October to December (3 months)
PPC Results
The Background
Scaling a Competitive Consumer Product on Amazon
The product operates in a highly competitive Amazon category where multiple sellers compete on price, placement, and conversion efficiency. Paid media is the primary growth lever, but scaling spend without discipline quickly erodes margin.
At the start of October, the product was generating consistent sales but profitability was constrained. Advertising spend was necessary for visibility, yet efficiency metrics left limited room for aggressive scaling.
The objective of the engagement was to increase revenue and profit simultaneously—without relying on disproportionate ad spend increases.
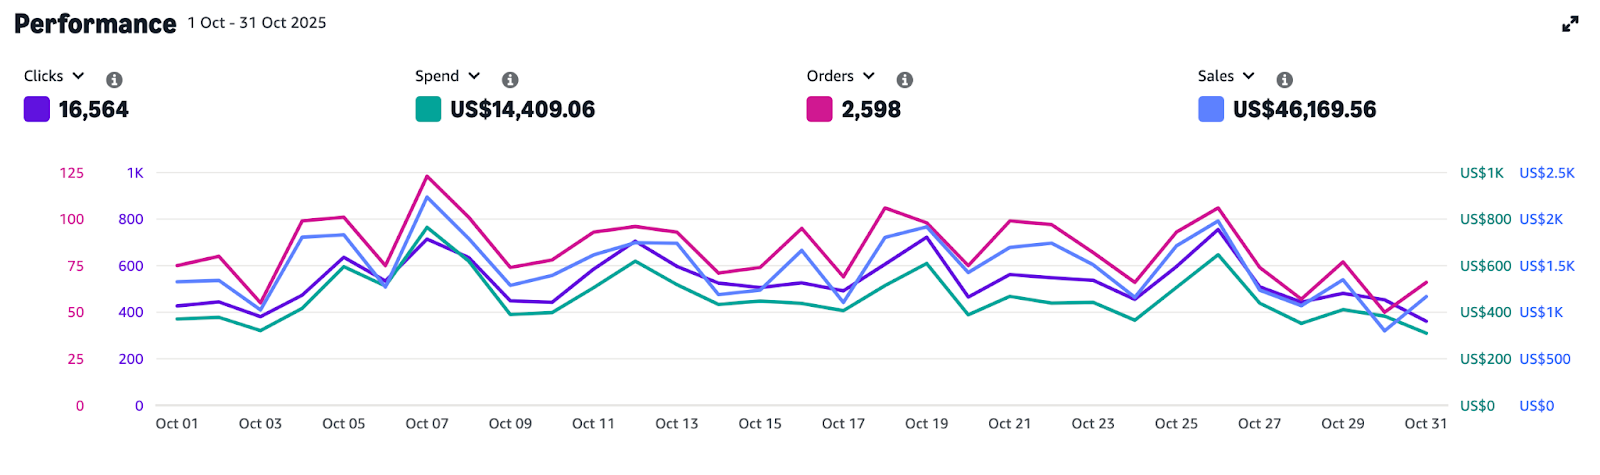
Amazon Ads performance overview – October (baseline trend).
The Challenge
Growth Without Margin Loss
Initial performance analysis highlighted several constraints:
- !Revenue growth was tightly linked to ad spend increases.
- !Efficiency metrics (ACOS and TACOS) limited safe scaling.
- !Conversion stability needed to be maintained during increased traffic.
- !Spend needed tighter control to avoid inefficient visibility.
The challenge was not generating demand, but scaling profitably under competitive pressure.
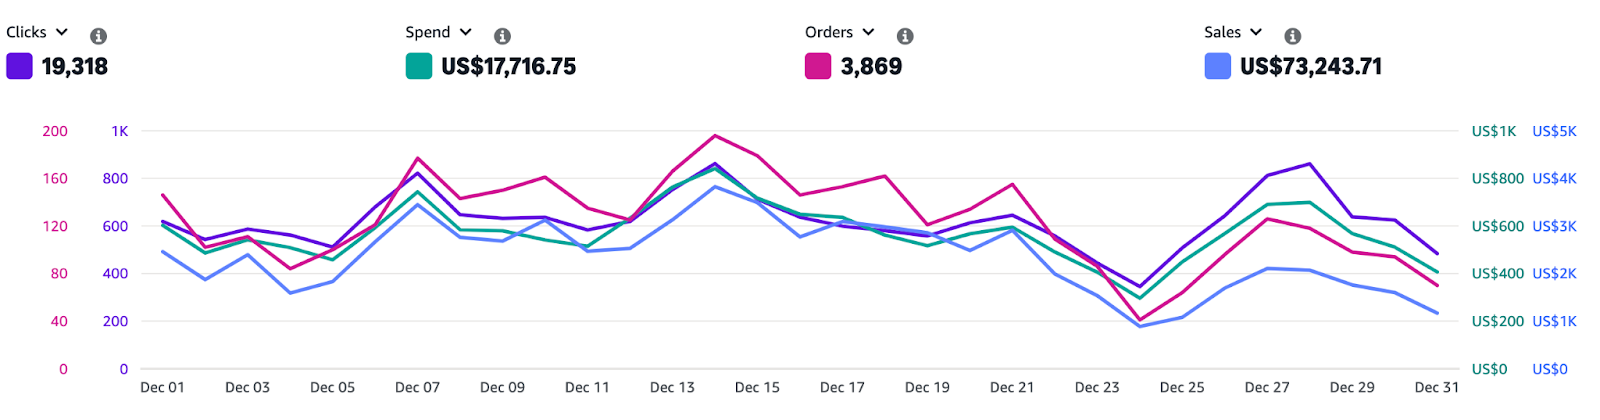
Amazon Ads search term / performance snapshot showing October efficiency baseline.
The Solution
Efficiency-First PPC Execution
A structured optimisation approach was implemented with a focus on control, intent, and conversion support.
Campaigns were restructured around intent-based segmentation, with ongoing search-term refinement, negative keyword expansion, and budget reallocation toward proven performers. Placement exposure was actively managed to avoid inefficient visibility, while listing-level adjustments were made to support conversion stability during scale.
We run Amazon accounts too. See our Amazon PPC service.
All optimisation decisions were guided by performance data from Amazon Ads and Seller Central reporting.
The Transformation
From Spend-Led Growth to Profit-Led Scale
Within three months, the account achieved significant performance gains while maintaining tight control over advertising growth.
Amazon PPC Performance
| KPI | October | December | Before vs after | Change |
|---|---|---|---|---|
| Clicks | 16,564 | 19,318 | +16.6% | |
| Ad Spend | $14,409.06 | $17,716.75 | +22.9% | |
| Orders | 2,598 | 3,869 | +48.9% | |
| Ad-Attributed Sales | $46,169.56 | $73,243.71 | +58.6% | |
| ACOS | 31.21% | 24.19% | −7.02 pts |
Business Performance
| KPI | October | December | Before vs after | Change |
|---|---|---|---|---|
| Total Sales | $70,601.39 | $131,335.39 | +86.0% | |
| Advertising Cost | $14,406.55 | $17,707.00 | +22.9% | |
| Net Profit | $8,621.09 | $35,408.48 | +310.7% | |
| TACOS | 20.41% | 13.48% | −6.93 pts |
TACOS declined materially during scale, confirming that revenue growth outpaced advertising investment.
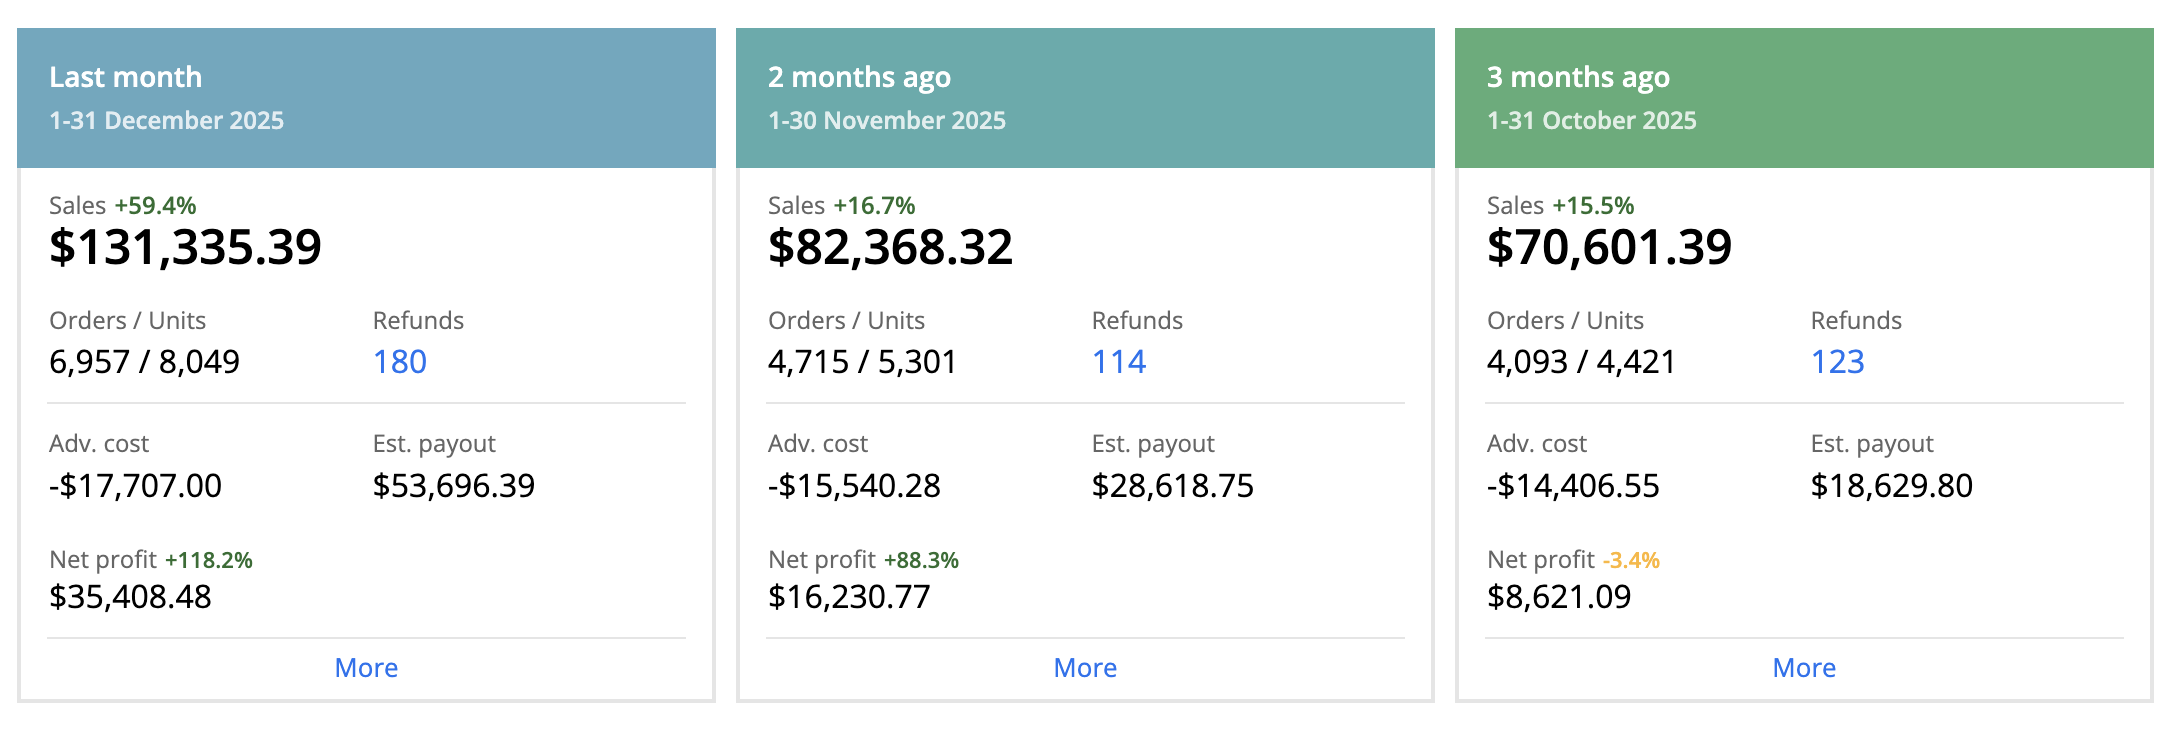
- Amazon Ads performance graphs (Oct vs Dec)
- Seller Central profit dashboard (Oct / Nov / Dec comparison)
The Result
Progress Proven by Data
- Revenue increased by 86% in three months
- Net profit increased by 310.7%
- Ad-attributed sales increased by 58.6%
- TACOS reduced from 20.41% to 13.48%
- ACOS improved while spend increased modestly
The data confirms that growth was driven by efficiency improvements rather than budget-led expansion.
Year-over-Year Performance Expansion (Oct–Dec)
Beyond month-over-month scaling, the account demonstrated exceptional year-over-year growth when comparing the same October–December period against the previous year.
Year-over-Year Growth Highlights (Oct–Dec)
- Revenue increased by approximately 401% year over year
- Units sold increased by approximately 419% year over year
This means the account delivered over 4× growth in both revenue and unit volume compared to the same calendar period one year earlier.
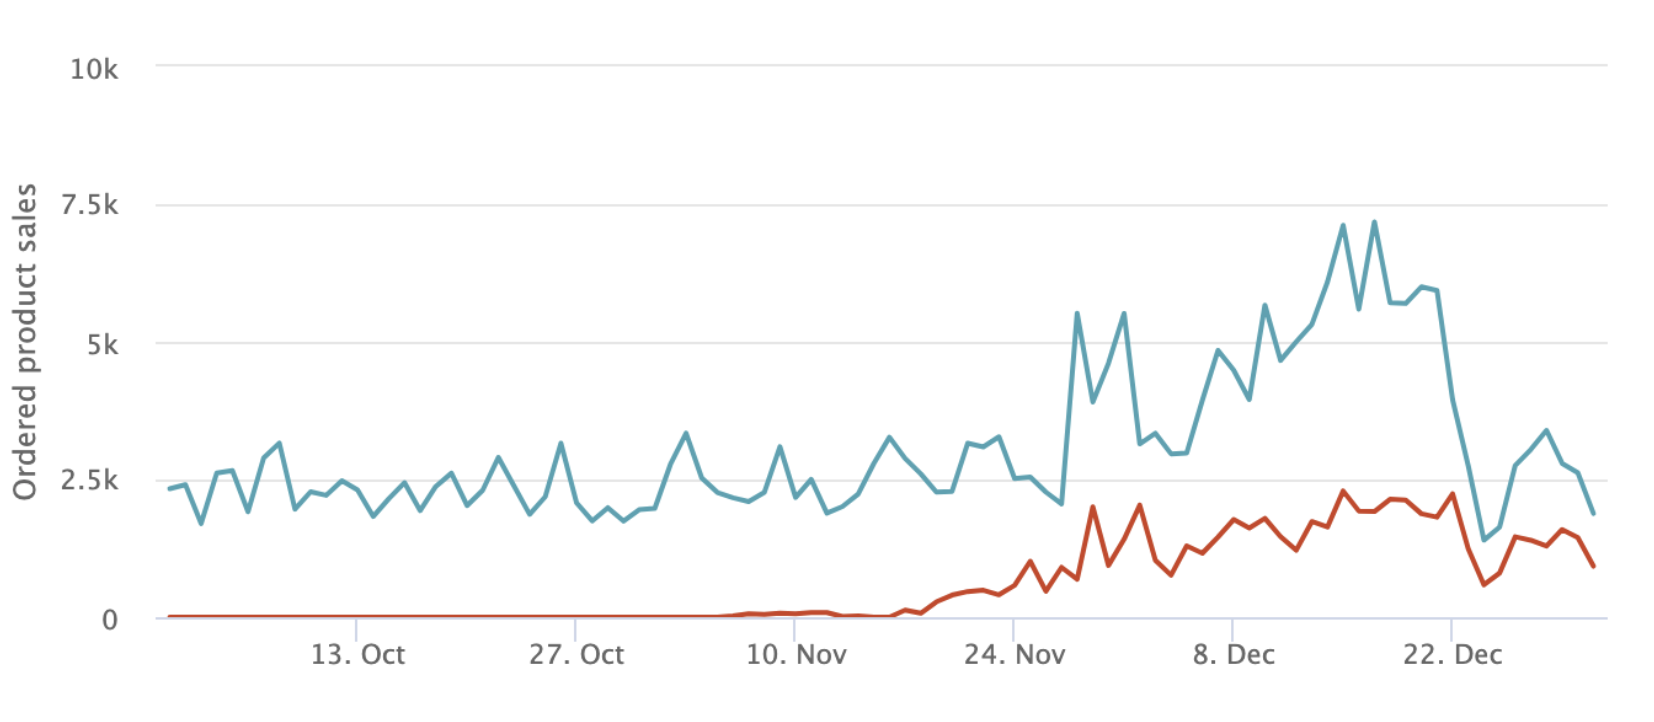
“Red line indicates the prior year while blue shows the program year, sales for Oct to Dec”
Our Role
Performance Control at Scale
The engagement focused on PPC optimisation, spend efficiency management, and listing-level support during scale. Performance improvements were validated through Amazon Ads reporting and Seller Central business data.
Key Takeaway
On Amazon, sustainable scale comes from efficiency and control, not higher ad spend.
Data Verification
All metrics and outcomes were verified using the Amazon Ads Console and Amazon Seller Central Business Reports for the period from October 1 to December 31.
TACOS was calculated as Advertising Cost ÷ Total Sales using Seller Central revenue and ad cost data.
No projections or estimates were included.
Want results like these for your brand?
Every one of these started with the same thing: a close look at where the ad budget was going and what it was actually buying.